
UML Diagrams
UML diagrams are standardized visual representations used throughout the software development lifecycle to model system architecture, behavior, and structure.
When to Use UML Diagrams in SDLC
Requirements Analysis Phase
- Use Case Diagrams - Capture functional requirements and user interactions
- Activity Diagrams - Model business processes and workflows
System Design Phase
- Class Diagrams - Define system structure and relationships
- Component Diagrams - Organize system into modular components
- Sequence Diagrams - Model object interactions over time
Architecture Design Phase
- Deployment Diagrams - Plan physical deployment of system components
- Package Diagrams - Organize system into logical packages
Implementation Phase
- Class Diagrams - Guide code structure and implementation
- Sequence Diagrams - Verify interaction flows during development
Testing Phase
- Sequence Diagrams - Design test scenarios and verify behavior
- State Diagrams - Test state transitions and edge cases
Most Useful UML Diagrams
1. Class Diagrams (80% Usage)
Purpose: Model static structure, classes, attributes, methods, and relationships
2. Sequence Diagrams (70% Usage)
Purpose: Show how objects interact over time in specific scenarios
3. Use Case Diagrams (60% Usage)
Purpose: Capture functional requirements and user interactions
4. Activity Diagrams (50% Usage)
Purpose: Model workflows, business processes, and complex algorithms
5. Component Diagrams (40% Usage)
Purpose: Organize system into reusable, modular components
6. Deployment Diagrams (30% Usage)
Purpose: Show physical deployment of software components
Class Diagrams
What They Are
Class diagrams show the static structure of a system by modeling classes, their attributes, methods, and relationships.
When to Use
- Requirements Analysis: Identify domain entities and their relationships
- System Design: Define system architecture and data models
- Implementation: Guide object-oriented code structure
- Documentation: Maintain system architecture documentation
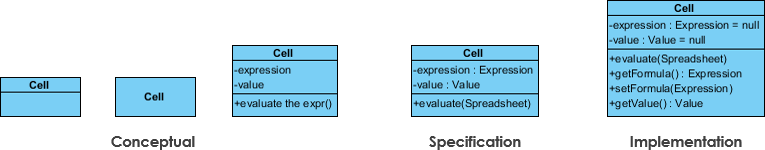
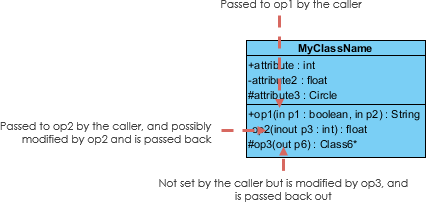
Key Elements
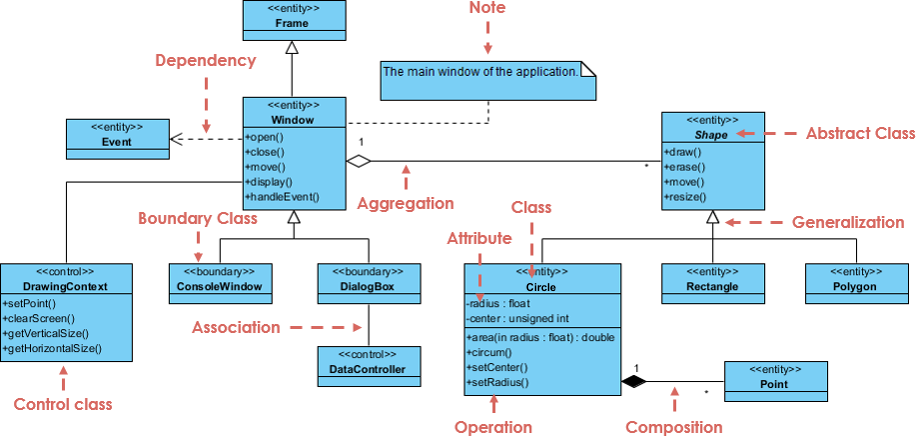
- Classes: Rectangles with three sections (name, attributes, methods)
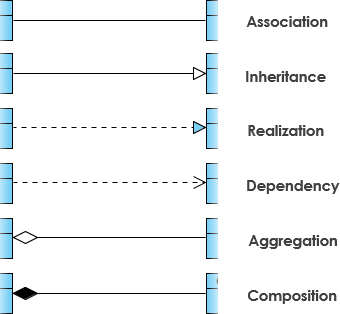
- Relationships: Associations, inheritance, composition, aggregation
- Multiplicity: Number of instances in relationships
- Visibility: Public (+), private (-), protected (#)
Illustrations
Best Practices
- Keep diagrams focused on specific subsystems
- Show only relevant attributes and methods
- Use clear, consistent naming conventions
- Include multiplicity and relationship types
Sequence Diagrams
What They Are
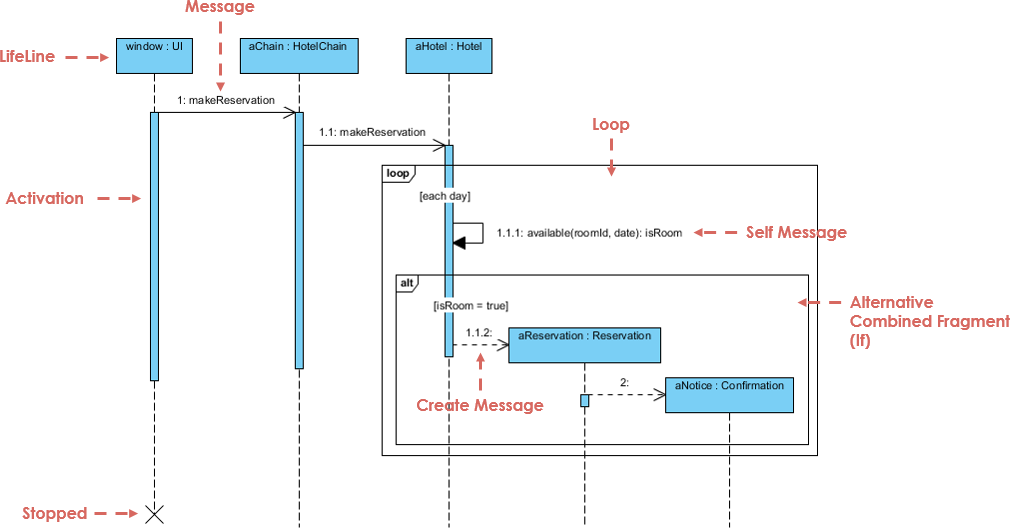
Sequence diagrams show how objects interact over time, focusing on the order of message exchanges.
When to Use
- System Design: Model complex interactions between components
- API Design: Define service interfaces and message flows
- Testing: Create test scenarios and verify behavior
- Debugging: Understand interaction flows for troubleshooting
Key Elements
- Actors/Objects: Vertical lifelines showing participants
- Messages: Horizontal arrows showing interactions
- Activation Boxes: Show when objects are active
- Return Messages: Dashed arrows showing responses
Example: User Authentication Flow
Illustrations
Best Practices
- Focus on one scenario per diagram
- Show error handling paths
- Include timing constraints when relevant
- Keep message names clear and concise
Use Case Diagrams
What They Are
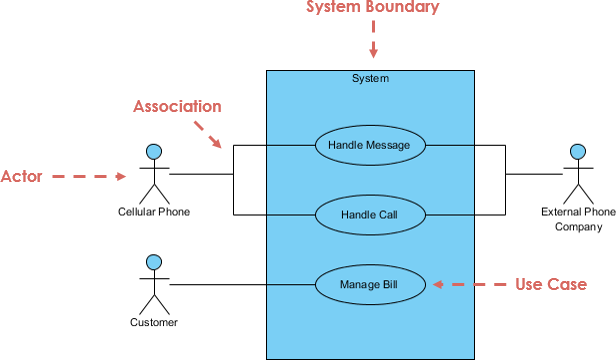
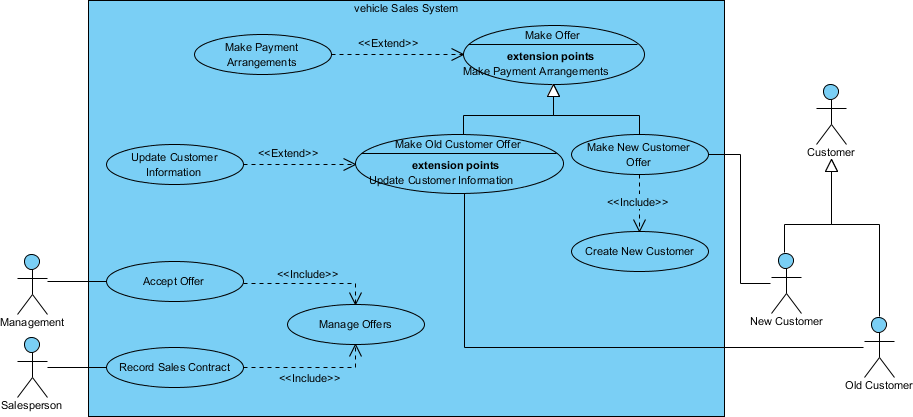
Use case diagrams capture functional requirements by showing how users (actors) interact with the system.
When to Use
- Requirements Gathering: Identify system functionality
- Project Scoping: Define system boundaries and features
- Communication: Share understanding with stakeholders
- Testing: Create acceptance criteria and test cases
Key Elements
- Actors: External entities that interact with the system
- Use Cases: System functionality (oval shapes)
- System Boundary: Rectangle containing use cases
- Relationships: Include, extend, generalization
Illustrations
Best Practices
- Keep use cases at appropriate level of detail
- Focus on user goals, not system functions
- Use clear, action-oriented names
- Show primary and secondary actors
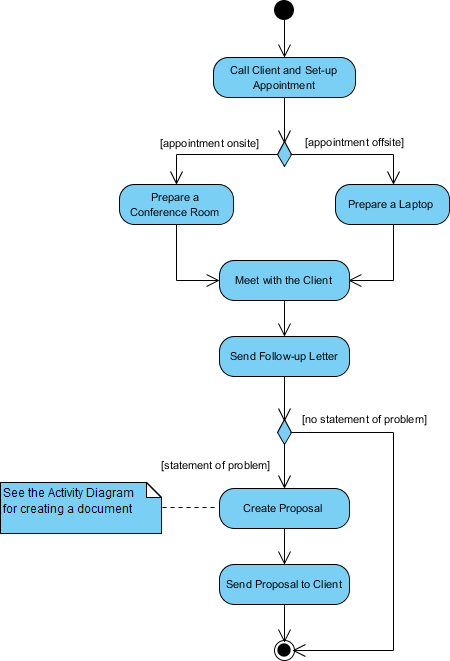
Activity Diagrams
What They Are
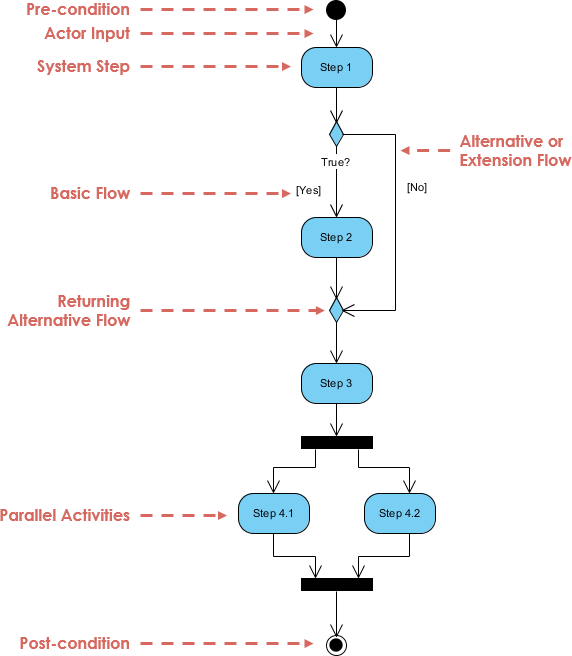
Activity diagrams model workflows, business processes, and complex algorithms showing the flow of activities.
When to Use
- Business Process Modeling: Document existing or proposed workflows
- Algorithm Design: Model complex decision logic
- Requirements Analysis: Understand process flows
- System Integration: Show how different systems interact
Key Elements
- Activities: Rounded rectangles showing actions
- Decision Nodes: Diamonds for conditional logic
- Fork/Join: Parallel processing flows
- Start/End Nodes: Initial and final states
Illustrations
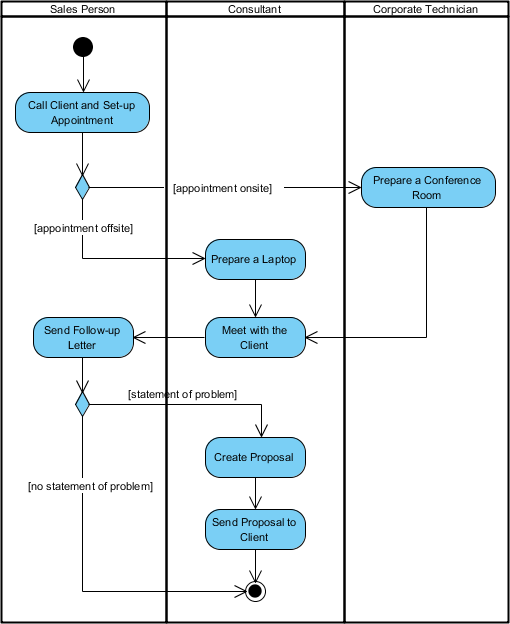
Best Practices
- Start with high-level activities, then refine
- Show decision points and alternative paths
- Use swimlanes for different actors/systems
- Include error handling flows
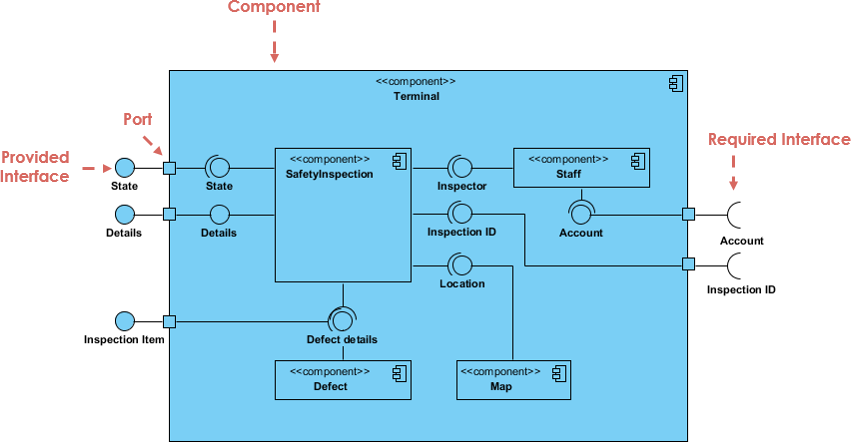
Component Diagrams
What They Are
Component diagrams show how a system is organized into components and their dependencies.
When to Use
- Architecture Design: Define system modules and interfaces
- Team Organization: Assign components to development teams
- Deployment Planning: Understand component dependencies
- Refactoring: Identify coupling and cohesion issues
Key Elements
- Components: Rectangles with component stereotype
- Interfaces: Provided and required interfaces
- Dependencies: Arrows showing relationships
- Ports: Connection points for interfaces
Illustrations
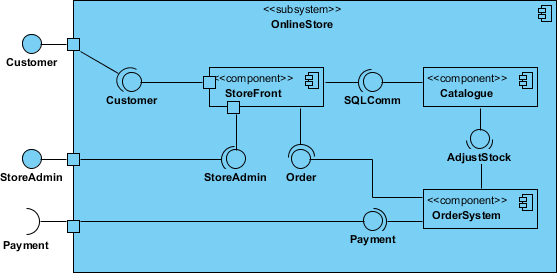
Best Practices
- Group related components into packages
- Show key interfaces and dependencies
- Avoid circular dependencies
- Keep component granularity consistent
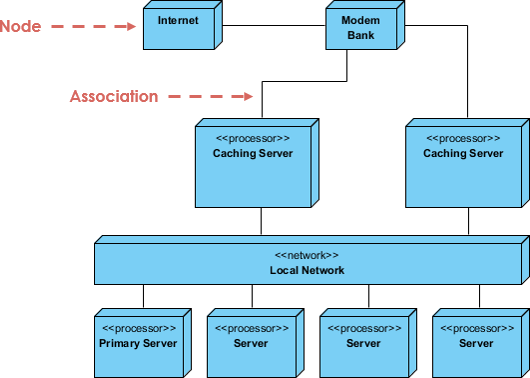
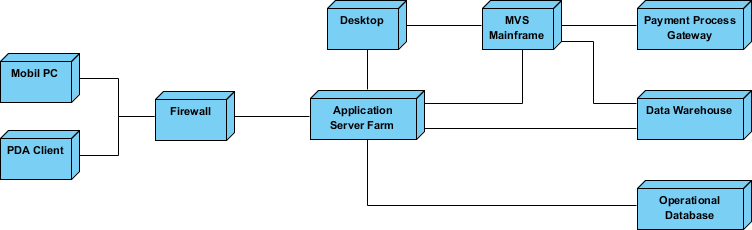
Deployment Diagrams
What They Are
Deployment diagrams show the physical deployment of software components on hardware infrastructure.
When to Use
- Infrastructure Planning: Design system deployment architecture
- DevOps: Plan CI/CD pipelines and environments
- Scaling: Understand resource requirements and bottlenecks
- Troubleshooting: Visualize system topology for debugging
Key Elements
- Nodes: Physical or virtual machines, containers
- Artifacts: Deployable software components
- Communication Paths: Network connections
- Deployment Specifications: Configuration details
Illustrations
Best Practices
- Show actual deployment topology
- Include network protocols and ports
- Specify hardware/infrastructure details
- Document security boundaries
Best Practices
General Guidelines
- Start Simple: Begin with high-level diagrams, then add detail
- Focus on Purpose: Each diagram should have a clear objective
- Keep Current: Update diagrams as system evolves
- Use Standards: Follow UML conventions and notation
- Review Regularly: Validate diagrams with stakeholders
When to Create UML Diagrams
Always Create:
- Class diagrams for core domain models
- Sequence diagrams for complex interactions
- Use case diagrams for requirement validation
Create When Needed:
- Activity diagrams for complex business processes
- Component diagrams for modular architectures
- Deployment diagrams for distributed systems
Avoid Over-Modeling:
- Don't diagram simple, well-understood concepts
- Focus on areas of high complexity or risk
Integration with Development
- Version Control: Store diagram sources in Git
- Documentation: Include diagrams in technical documentation
- Code Generation: Use tools that generate code from models
- Reverse Engineering: Generate diagrams from existing code
Quick Reference
Tool Selection Guide
- Developers: PlantUML + VS Code/IntelliJ
- Architects: Visual Paradigm or StarUML
- Teams: Lucidchart or Draw.io
- Documentation: PlantUML (version controllable)
Diagram Usage Matrix
| Diagram Type | Usage % | Best For | Phase |
|---|---|---|---|
| Class | 80% | Static structure, relationships | Design, Implementation |
| Sequence | 70% | Object interactions, API flows | Design, Testing |
| Use Case | 60% | Functional requirements | Requirements |
| Activity | 50% | Workflows, business processes | Requirements, Design |
| Component | 40% | System modules, architecture | Architecture |
| Deployment | 30% | Physical deployment | Architecture |
When to Create UML Diagrams
Always Create:
- Class diagrams for core domain models
- Sequence diagrams for complex interactions
- Use case diagrams for requirement validation
Create When Needed:
- Activity diagrams for complex business processes
- Component diagrams for modular architectures
- Deployment diagrams for distributed systems
Avoid Over-Modeling:
- Don’t diagram simple, well-understood concepts
- Focus on areas of high complexity or risk
Found this guide helpful? Share it with your team:
Share on LinkedIn